
Are we headed for a recession?
Are we headed for a recession?
2s10s inversion has preceded every recession since 1956. Where are we now?

Good morning Decentralized Way subscribers!
Did you know that something called a ‘yield inversion’ has preceded and predicted every recession since 1956? Source.
Well today we have a fun topic - yield curves. Maybe you’ve seen people blabbing about something called a ‘2s10s spread’ while trying to sound smart. Or maybe you haven’t.
This article will break down what a ‘2s10s spread’ is, why it matters, and what it’s telling us… All in plain English. By the end, you’ll be a bond and yield curve expert.
And you’ll be able to tell if we’re headed for a recession via one of the most trusted indicators around.
Let’s dive right in.
Show me the data!
As you wish. Check out this chart from the Chicago Fed. Source.

The grey periods are recessions, as determined by the National Bureau of Economic Research.
The blue line is the 10-2 year yield curve spread (and if you don’t know what that means… Hang on, we’re gonna get there).
The important thing to notice here is that every time that blue line goes below zero, a recession follows.
Seems alarming, but what is a yield curve anyway?
Let’s actually back up even further and explain what a bond is, then what yield is, then what a yield curve is.
I’ll borrow a bit from Investor.gov here to explain what a bond is… Source.
A bond is a debt security, similar to an IOU. Borrowers issue bonds to raise money from investors willing to lend them money for a certain amount of time.
When you buy a bond, you are lending to the issuer, which may be a government, municipality, or corporation. In return, the issuer promises to pay you a specified rate of interest during the life of the bond and to repay the principal, also known as face value or par value of the bond, when it "matures," or comes due after a set period of time.
In English - I tell you I want $100 dollars and offer to pay you 5% for loaning it to me over the course of 10 years. I’ll pay you $5 in interest over the course of those 10 years, and then pay you the original $100 I borrowed from you back at year 10.
And yield is the interest rate at which bonds are being issued. Also known as the $5 I offered to pay you.
When people talk about ‘yield’, they’re really talking about the US Treasury Yield - Also known as the effective rate at which the US Government is borrowing money (and paying you for loaning it).
Investors may choose to lend the US Government money, since it is seen as the safest possible place to park cash, given that the US has never defaulted on debt.
Ok now you’re ready. It’s yield curve time.
In semi English - Yield curve is just a fancy term for a chart that plots the yields for different maturities… aka maturity dates (set sometime in the future).
In very plain English - It’s a chart that shows you the interest rate for loaning out your money for a period of time to the US Government (commonly 2 years, 10 years, 30 years).
What’s up with the whole 2 year, 10 year, 30 year deal?
Think short term versus long term.
2y = Indicator for current and short term economic situation
10y = Indicator for long term economic situation
30y = Indicator for when I have grey hair
Note - This isn’t exact science of course, but you already knew that since you’re a Decentralized Way subscriber!
Each one of these time horizons has its own yield curve. As the length of time increases, the rate of return tends to increase as well - Which makes sense because you’re loaning your money out for longer, so you should be compensated for that extra time.
This typically results in a normal yield curve, where it trends upward. Aka more time = higher interest rate.
A normal (upward trending) yield curve is a classic sign of a healthy economy. It shows growth, a tiny bit of (healthy) inflation, and the likelihood that the Fed will increase interest rates over time (since higher rates at further maturities are ‘pricing in’ future rate hikes).
That makes sense right? (And if you said yes except for that last bit in parenthesis, keep going).
What about a yield inversion?
Ah the topic of this article. Congrats on making it this far, this stuff ain’t easy.
An inverted yield curve means that short term rates are higher than long term rates.
To reiterate - it means that lenders think you are more likely to repay later. Aka not in the near future.
In other words - it means that they think some funky business (see: recession) is going to go down in the short term, and they’d actually rather you keep the money for a longer period of time!
Example time!
Imagine you’re an investor and you think some funky business (see: recession) is likely in the next few years.
Funky business = Recession = Stocks (aka equities… S&P500, etc) either go down or stay flat in a best case scenario.
So you think your money is better off buying bonds instead of equities.
But your short term view is negative because you think funky business may happen soon right? So you don’t want the 2 year treasuries… Creating less demand.
But on a 10 year horizon, you think there’s a pretty good chance the markets have recovered again! So you buy 10 year treasuries… Creating more demand.
It’s supply and demand time!
Bonds have an inverse relationship when it comes to price and yield… Meaning if it’s cheap, the yield is high to entice investors to buy! And the other way around, if it’s expensive, there’s not much yield to be had, telling investors to seek greener pastures elsewhere.
So that looks something like this in our scenario…
Demand for 2y treasuries ⬇️ = Price ⬇️ = Yield ⬆️
Demand for 10y treasuries ⬆️ = Price ⬆️ = Yield ⬇️
Our example centers around the 2y10y spread. Also known as the 2s10s spread.
But it’s simply taking the 10y rate and subtracting the 2y rate.
Aka 10y rate - 2y rate.
And the 2s10s inverting has predicted every major recession since 1956, remember?
I get it now, but is it inverted?
Not quite yet. Check out this graph below from the St. Louis Fed. Source.
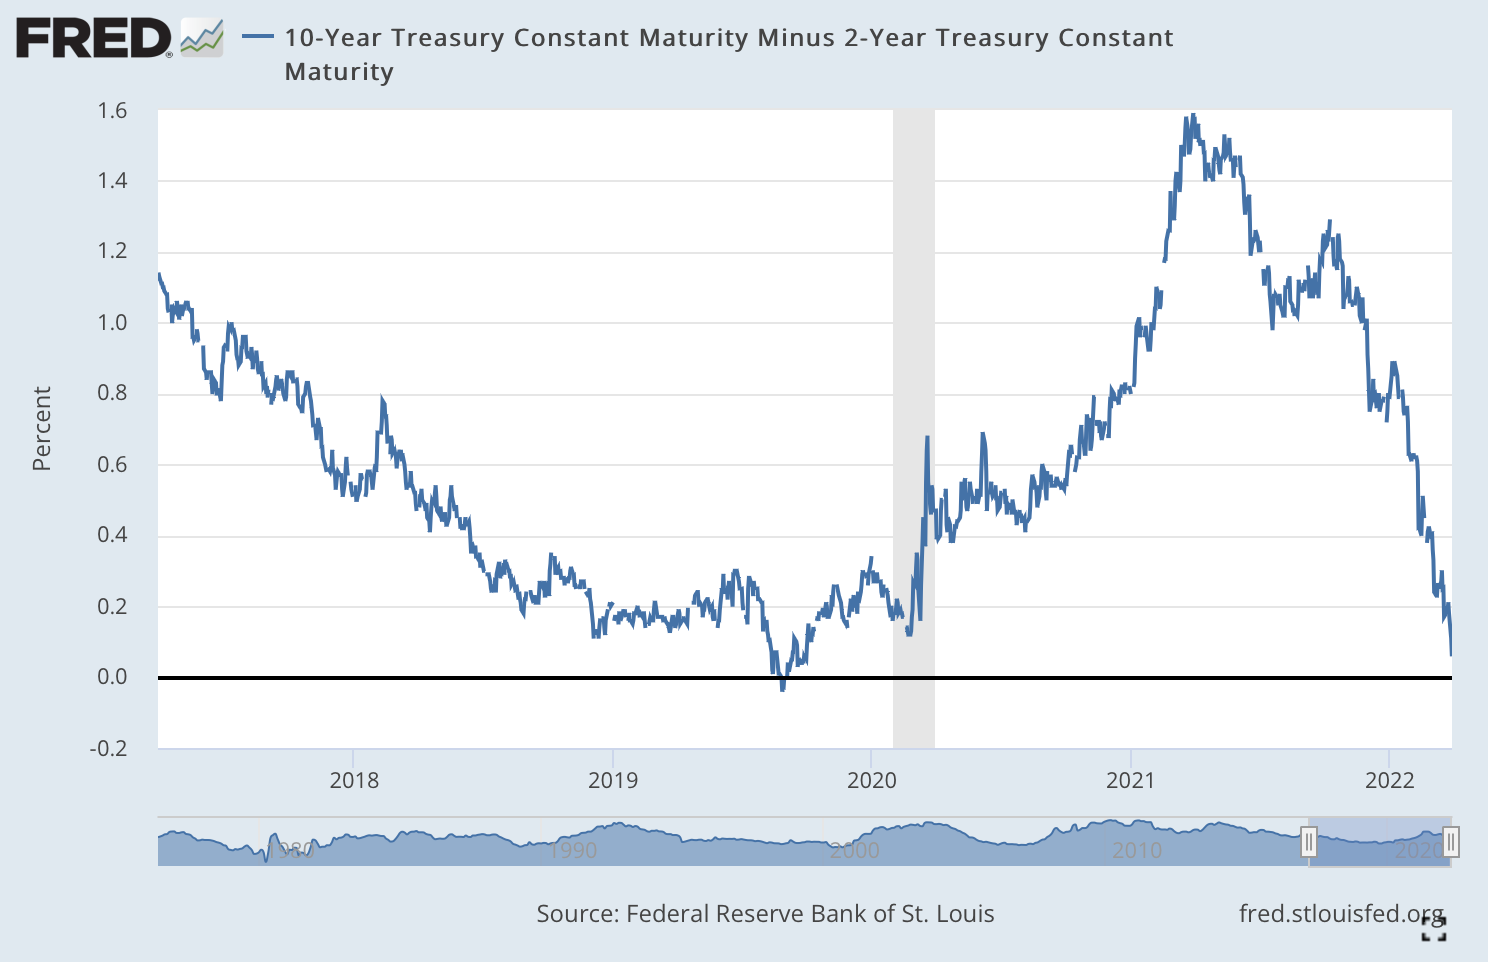
Oh boy is it getting close!
As of writing (Tuesday, 3/29/2022), the spread on the 2s10s is sitting at just 6bps!
Or in English… 0.06%. It’s like standing on the edge of the diving board, peeking over. Not quite there yet but you’re only a step away.
This screams investors are betting funky business goes down sooner rather than later.
So a recession coming?
Maybe. Just because an indicator has been right every time since 1956 doesn’t mean that it’ll be right again in 2022.
I would also be remiss to not include some opponents of this indicator that say ‘this time is different.’ That an inversion of the yield curve is simply driven by ‘technicals’ and a desire for investors to purchase 10y as a safe haven which drives yield down.
It would also hardly be a Decentralized Way article without a mention of inflation! Which would likely be a byproduct of a recession (as if it’s not high enough already), as the Fed starts up the money printers (again) to try and dig out of it.
But truly nobody knows. If this was the only indicator flashing, maybe it would be worth ignoring. But as a reader of the Decentralized Way, you know this is far from the case.
I’ll leave you here to draw your own conclusions. And remind you to keep buying Bitcoin (and Ethereum). After all, the only cure for irresponsible fiscal policy is hard money (see: something central bankers can’t just print out of thin air).
It is possible we live at one of the most pivotal and interesting times in all of human history so buckle up, this one may get bumpy.